Debug in PhpStorm and browser
DevBox is currently undergoing an update and is not available for download. A new version will be available in the near future. Please check back for updates.
This topic discusses how to debug custom code using PhpStorm and the Chrome web browser using Xdebug.
PhpStorm notes:
- The instructions in this topic are based on PhpStorm version 2016.3.2. If you use a different version, some steps might be different. Consult your PhpStorm documentation for details.
-
PhpStorm has a commonly used window that has a different name in Windows and Mac OS:
- Windows: The window is named Settings and you access it by clicking File > Settings.
- Mac OS: The window is named Preferences and you access it by clicking PhpStorm > Preferences.
Create an SSH tunnel
Before you run Xdebug, you must create an SSH tunnel to the DevBox container.
SSH tunnel: Windows
To use an SSH tunnel on Windows:
- See Create an SSH tunnel on Windows.
- Start Putty.
- From the Saved Sessions list, click the name of your DevBox SSH session and click Load.
- Click Open.
- At the
Login asprompt, entermagento2
SSH tunnel: Mac OS
To create an SSH tunnel on Mac OS, open a Terminal window and enter the following command:
./<DevBox root folder>/m2devbox-debug.sh
Debug code with Xdebug
This section discusses how to debug code using Xdebug using PhpStorm and a web browser. For demonstration purposes, this topic discusses how to test Magento modules. Typically, you’ll test your own code; adjust the procedures as required.
Debug with PhpStorm and Xdebug
This topic discusses one way to debug code using PhpStorm. For additional information, consult the PhpStorm documentation.
To debug code with PhpStorm and Xdebug:
- Create an SSH tunnel to the DevBox container.
- Open your DevBox PhpStorm project.
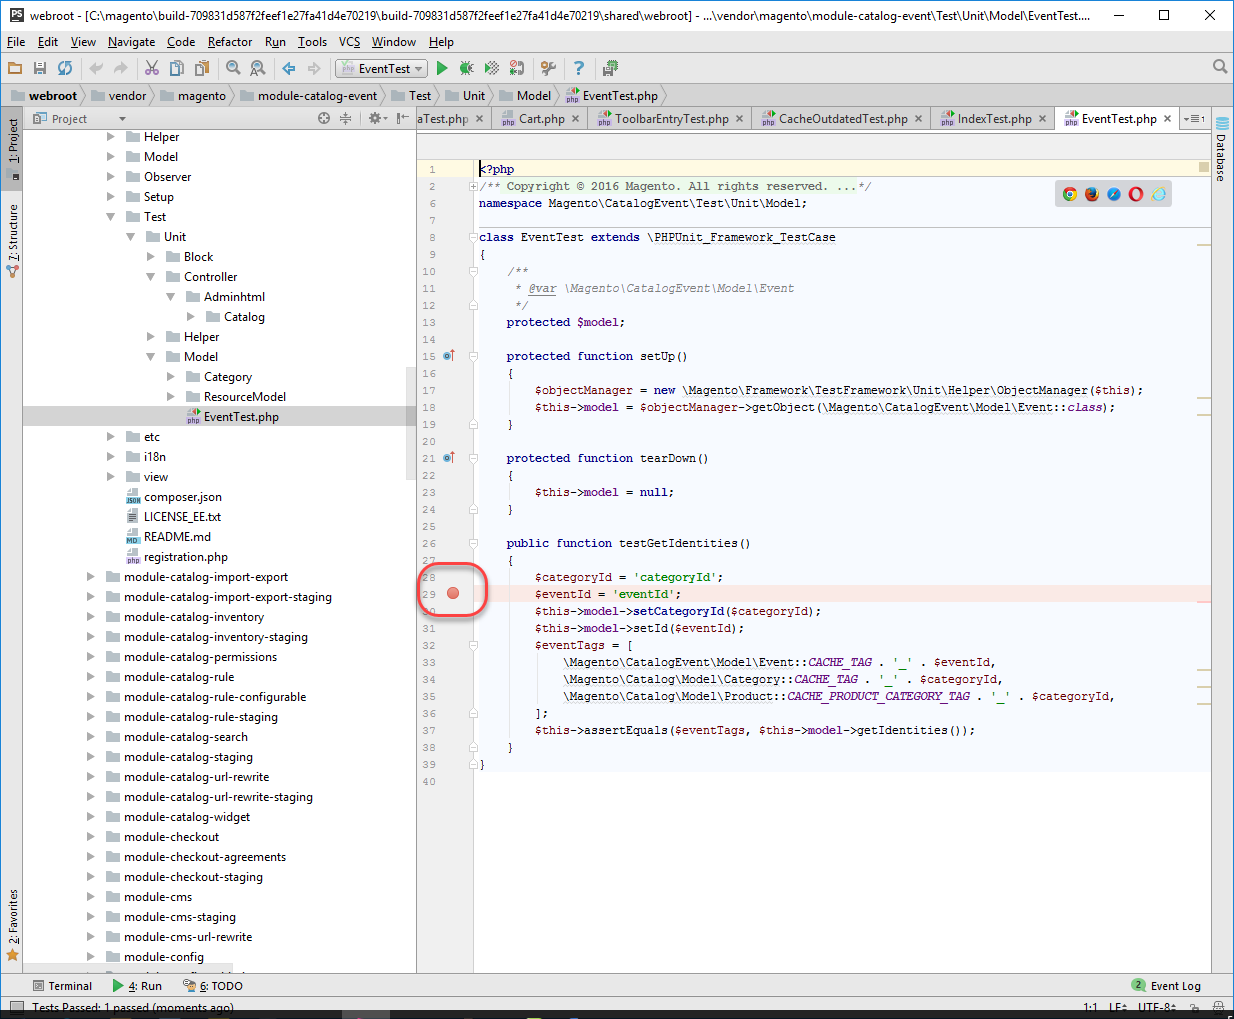
- In the navigation window, expand the code to reveal a PHP file to test.
- Double-click the file to open it.
-
In the right pane, in the gray area next to a line number, click to set a breakpoint (
 ).
).The following figure shows an example.
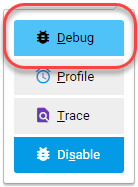
-
In the top navigation bar, click
 (Debug).
If the navigation bar doesn’t display, click View > Navigation Bar.
You can also right-click the PHP file name in the left pane and, from the pop-up menu, click Debug. (If more than one debug option is displayed, click the PHP option
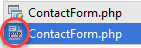 .
.Results are displayed in the console pane as follows:
Troubleshooting
This section discusses possible errors and how to solve them.
-
Problem: The following error is displayed:
Connection with 'xdebug 2.5.0' was not established. Validate installation.Solution: Make sure you created an SSH tunnel to the DevBox container and try again.
-
Problem: When you debug a PHP file, a web browser window opens.
Solution:
-
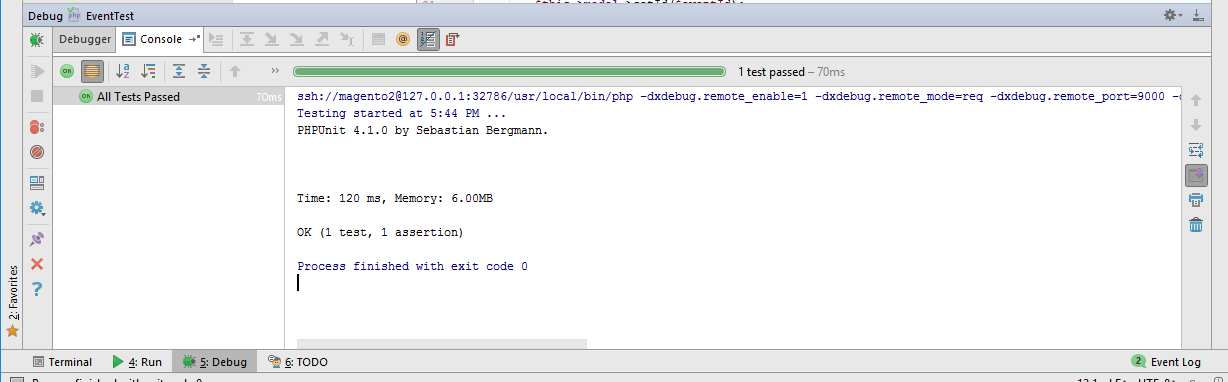
In the PhpStorm toolbar, click Edit Configurations from the Run/Edit Configurations button as the following figure shows.
-
If there is a JavaScript configuration defined, click its name and delete it as the following figure shows.
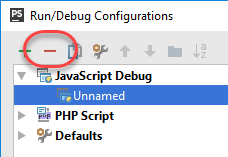
-
Click OK and try your test again.
-
Use Xdebug in a browser
This section discusses how to use Xdebug in Chrome using the Xdebug Helper extension. For information about Xdebug tools for other browsers, consult the browser documentation.
To use Xdebug Helper with Chrome:
- Create an SSH tunnel to the DevBox container.
- Install the Xdebug Helper extension from the Chrome store.
-
Enable the extension in Chrome as shown in the following figure.
- Open your DevBox PhpStorm project.
-
In the top navigation bar, click
 (Start listening).
If the navigation bar isn’t displayed, click View > Navigation Bar.
- In the PhpStorm navigation pane, double-click the PHP file to test.
- In the right pane, in the gray area next to a line number, click to set a breakpoint ().
-
In Chrome, go to a URL that invokes the breakpoint.
If Chrome is already displaying the URL, click Refresh in the Chrome toolbar.
If the Incoming Connection from Xdebug dialog box displays, select the same file in which you set the breakpoint and click Accept.