Configure Xdebug
We recommend using Xdebug for your PHP debugging. The following sections detail how to configure Xdebug and PhpStorm to work locally with settings in your environments. You can use any IDE of your choice. Please see the vendor documentation for those applications for further configuration information.
To set up Xdebug, you need to configure a file in your Git repo, configure your IDE PhpStorm, and set up port forwarding. You will configure settings in the magento.app.yaml file. After editing, you can push the Git changes across all Starter environments and Pro Integration environments to enable Xdebug. To push these settings to Pro plan Staging and Production environments, you must enter a ticket.
Once configured, you can debug CLI commands, web requests, code. Remember, all Magento Commerce (Cloud) environments are read-only. You will need to pull code to your local development environment to perform debugging. For Pro plan Staging and Production, we include additional instructions for Xdebug on those environments.
Requirements
To run and use Xdebug, you will need the environment’s SSH URL. You can locate the information through the Project Web Interface or your spreadsheet.
Configure Xdebug
To configure Xdebug, you need to do the following:
- Work in a branch to push file updates
- Enable Xdebug for environments
- Configure your IDE, like PhpStorm
- Set up port forwarding
For configuring on Pro plan Staging and Production, you need to enter a ticket for Staging and Production.
Get started with a branch
To add Xdebug, we recommend creating a branch to work in and add the files.
- Log in to your local development system, or switch to, the Magento file system owner.
- Change to a directory to which the Magento file system owner has write access.
-
Enter the following command in a terminal to log in to your project:
magento-cloud login -
List your projects. With the project ID, you can complete additional commands.
magento-cloud project:list -
If necessary, clone the project to your local. You should have cloned when setting up your local development workspace.
magento-cloud project:get <project ID> - Change to a project directory. For example,
cd /var/www/html/magento2 -
List environments in the project. Every environment includes an active Git branch of your code, database, environment variables, configurations, and services.
magento-cloud environment:listmagento-cloud environment:listdisplays environment hierarchies whereasgit branchdisplays does not. If you have any nested environments, usemagento-cloud environment:listto see the full list. -
Fetch origin branches to get the latest code:
git fetch origin -
Check out, or switch to, a specific branch and environment. Git commands only checkout the Git branch. The Magento Cloud command also switches to the active environment.
magento-cloud environment:checkout <environment ID>To create a new environment, use
magento-cloud environment:branch <environment name> <parent environment ID> -
Pull any updated code to your local for the environment ID (which is the Git branch):
git pull origin <environment ID> -
Create a snapshot of the environment as a backup:
magento-cloud snapshot:create -e <environment ID>
Enable Xdebug in your environment
Enable Xdebug by adding it to the extensions section of magento.app.yaml. When you push this update to Git and deploy to environments, the debugger is available.
You can enable Xdebug directly to all Starter environments and Pro Integration environments. For Pro Staging and Production, you need to update this file and enter a Support ticket to have it enabled. We will get Xdebug enabled onto those environments for you.
- In your local terminal, open
.magento.app.yamlin a text editor. -
In the
runtimesection, underextensions, addxdebug. For example:runtime: extensions: - mcrypt - redis - xsl - json - xdebug -
Optionally, modify the timeout. A default timeout of 300 seconds (5 minutes) is set in
php-fpmand will end your session. To avoid the timeout, add the following lines to theweb:section of.magento.app.yaml:web: commands: start: | cat /etc/php/7.0/fpm/php-fpm.conf | sed -e 's/request_terminate_timeout.*//g' > /tmp/php-fpm.conf /usr/sbin/php-fpm7.0 -y /tmp/php-fpm.conf - Save your changes to
.magento.app.yamland exit the text editor. -
Add, commit, and push the changes to redeploy the environment:
 git add -A
 git commit -m "Add xdebug"
 git push origin <environment ID>
When deployed to Starter environments and Pro Integration environments, Xdebug is now available. You should continue configuring your IDE. For PhpStorm, see Configure PhpStorm.
Configure PhpStorm
You need to configure PhpStorm to properly work with Xdebug.
- Open your PhpStorm project.
-
Open the settings for PhpStorm.
- On Mac, select File > Preferences.
- On Windows/Linux, select File > Settings.
- Expand and locate Languages & Frameworks > PHP > Servers section in settings.
- Add a server configuration. Click the + to add a server. Notice at the top, it will show the project name in grey, just for reference. This will create a “server” configuration. This will be used to listen to port 9000 locally, which will be forwarded.
-
Configure settings for the new server:
- Name: enter the same as the hostname. This value ise used in and must match the value for
PHP_IDE_CONFIGvariable in Debug CLI commands. - Host: enter
localhost - Port: enter 80
- Debugger: set to Xdebug in the drop-down
- Name: enter the same as the hostname. This value ise used in and must match the value for
- Select the Use path mappings option. In the files/directories, the root of the project displays that you opened for the added server.
-
In the Absolute path on the server column, click
 (Edit) and add a setting based on the environment:
- For all Starter environments and Pro Integration environments, the remote path is
/app. -
For Pro Staging and Production environments:
- Production:
/app/<project_code>/ - Staging:
/app/<project_code>_stg/
- Production:
- For all Starter environments and Pro Integration environments, the remote path is
Set up port forwarding
You need to set up port forwarding. This is necessary to map the XDEBUG connection from the server to your local system to PHPSTORM and xdebug locally can track along with it
To do any type of debugging, you must forward port 9000 from your Magento Commerce (Cloud) server to your local machine. See one of the following sections:
Port forwarding on Mac or UNIX
To set up port forwarding on a Mac or in a Unix environment, you will enter a command in a terminal.
- Open a terminal.
-
Enter the following command:
ssh -R 9000:localhost:9000 <ssh url>Add the
-voption to the SSH command to show in the terminal whenever a socket is connected to the port that is being forwarded.
If an “unable to connect” or “could not listen to port on remote” error is displayed, there could be another active SSH session persisting on the server that is occupying port 9000. If that connection isn’t being used, you can terminate it.
To troubleshoot the connection:
- SSH to the integration, staging, or production server.
- Enter
whoto view a list of SSH sessions. -
View existing SSH sessions by user. Be careful to not affect a user other than yourself!
- Integration: user names are similar to
dd2q5ct7mhgus - Staging: user names are similar to
dd2q5ct7mhgus_stg - Production: user names are similar to
dd2q5ct7mhgus
- Integration: user names are similar to
- For a user session that is older than yours, find the pseudo-terminal (PTS) value. For example,
pts/0. -
Kill the process ID (PID) corresponding to the PTS value using the following commands:
ps aux | grep ssh
kill <PID>
For example, suppose
ps aux | grep sshreturned the following:dd2q5ct7mhgus 5504 0.0 0.0 82612 3664 ? S 18:45 0:00 sshd: dd2q5ct7mhgus@pts/0To terminate the connection, you enter a kill command with the process ID (PID). For example:
kill 3664
Port forwarding on Windows
To set up port forwarding (SSH tunneling) on Windows, you will configure your Windows terminal application. For this example, we walk through creating an SSH tunnel using Putty. You can use other applications such as Cygwin. For more information on other applications, please see the vendor documentation provided with those applications.
To set up an SSH tunnel on Windows using Putty:
- If you haven’t already done so, download Putty.
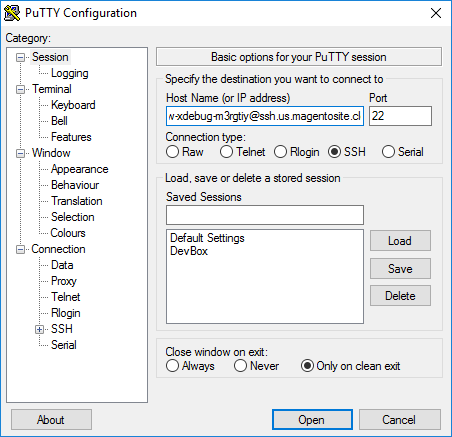
- Start Putty.
- In the Category pane, click Session.
-
Enter the following information:
- Host Name (or IP address) field: Enter your Cloud server’s SSH URL
- Port field: Enter
22
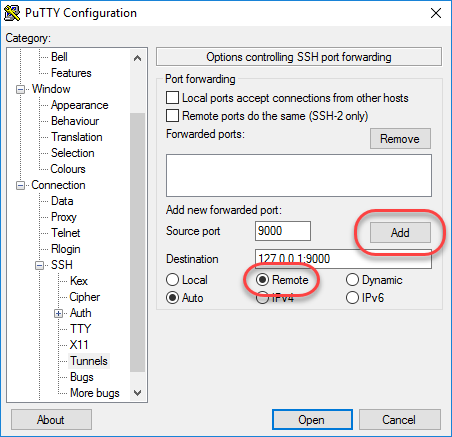
- In the Category pane, click Connection > SSH > Tunnels.
-
Enter the following information:
- Source port field: Enter
9000 - Destination field: Enter
127.0.0.1:9000 - Click Remote
- Source port field: Enter
-
Click Add.
- In the Category pane, click Session.
- In the Saved Sessions field, enter a name for this SSH tunnel.
-
Click Save.
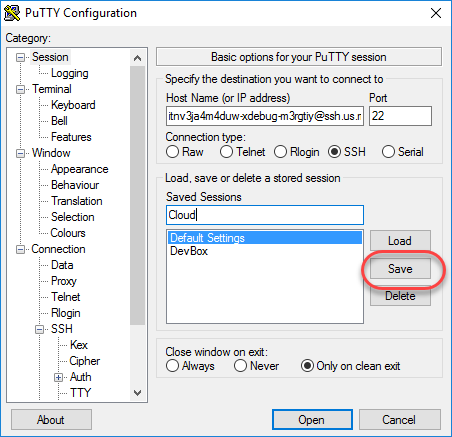
- To test the SSH tunnel, click Load, then click Open.
If an “unable to connect” error displays, verify all of the following:
- All Putty settings are correct
- You are running Putty on the machine on which your private Magento Commerce (Cloud) SSH keys are located
Configure Pro Staging and Production
To complete configuration for Pro plan Staging and Production environments, you must enter a Support ticket to have Xdebug enabled and configured in Staging and Production environments.
We will enable Xdebug in the environment. Be aware, this will require a redeployment of Staging and Production.
SSH access to Xdebug environments
For initiating debugging, performing setup, and more, you need the SSH commands for accessing the environments. You can get this information, through the Project Web Interface and your project spreadsheet.
For Starter environments and Pro Integration environments, you can use the following Magento Cloud CLI command to SSH into those environments:
magento-cloud environment:ssh --pipe -e <environment ID>
To use Xdebug, SSH to the environment as follows:
ssh -R <xdebug listen port>:<host>:<xdebug listen port> <SSH URL>
For example,
ssh -R 9000:localhost:9000 pwga8A0bhuk7o-mybranch@ssh.us.magentosite.cloud
Debug for Pro Staging and Production
To use Xdebug specifically on Pro plan Staging and Production environment, you create a separate SSH tunnel and web session only you have access to. This usage differs from typical access, only providing access to you and not to all users.
You will need the following:
- SSH commands for accessing the environments. You can get this information, through the Project Web Interface and your project spreadsheet.
- The
xdebug_keyvalue we set when configuring the Staging and Pro environments
Set up an SSH tunnel to Staging or Production environment:
- Open a terminal.
-
Enter the following command to clean up all SSH sessions.
ssh USERNAME@CLUSTER.ent.magento.cloud 'rm /run/platform/USERNAME/xdebug.sock' -
Enter the following command to set up the SSH tunnel for Xdebug:
ssh -R /run/platform/USERNAME/xdebug.sock:localhost:9000 -N USERNAME@CLUSTER.ent.magento.cloud
To start debugging, use the following commands with the environment URL:
-
To enable remote debugging, visit the site in the browser with the following added to the URL where
KEYis value forxdebug_key:?XDEBUG_SESSION_START=KEYThis sets the cookie that sends browser requests to trigger Xdebug.
- Complete your debugging with Xdebug.
-
When you are ready to end the session, you can use the following command to remove the cookie and end debugging through the browser where
KEYis value forxdebug_key:?XDEBUG_SESSION_STOP=KEY
Please note, XDEBUG_SESSION_STARTpassed by POST requersts are not supported at this time.
Debug CLI commands
This section walks through debugging CLI commands. To debug, you will need the SSH commands for your environments.
- SSH into the server you want to debug using CLI commands.
-
Create the following environment variables:
 export XDEBUG_CONFIG='PHPSTORM'
 export PHP_IDE_CONFIG="serverName=<name of the server that is configured in PHPSTORM>"
These variables will be removed when SSH session is over. When adding the variables, you can add runtime options:
php -d xdebug.profiler_enable=On -d xdebug.max_nesting_level=9999 ...
If you expect to SSH and debug multiple times, you can put the export commands into a bash script in the /tmp directory to run them each time.
For debugging web requests
The following steps help you debug web requests.
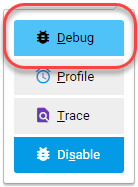
- On the Extension menu, click Debug to enable.
- Right click and on the options menu set the IDE key to PHPSTORM.
- Install the Xdebug client on the browser. Configure and enable it.
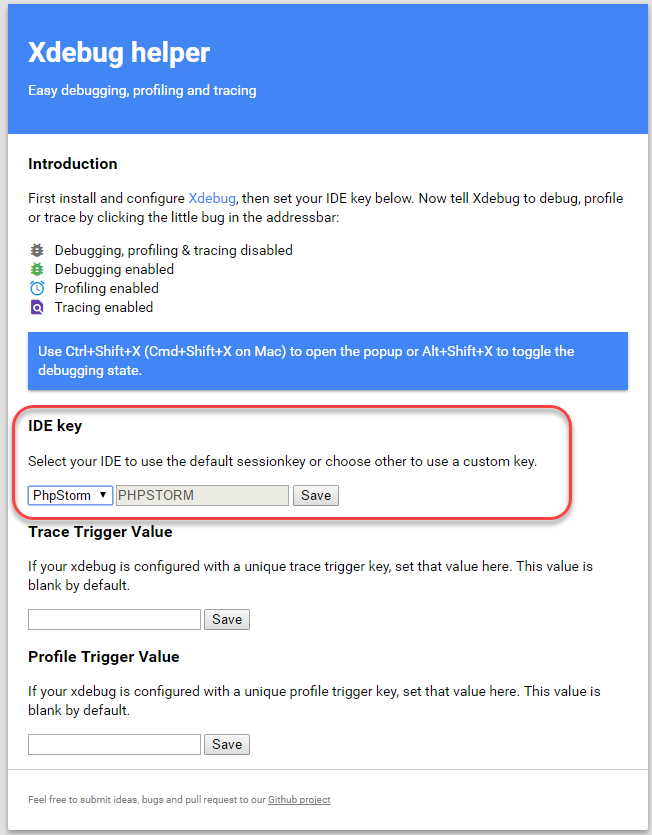
Example set up on Chrome
This section discusses how to use Xdebug in Chrome using the Xdebug Helper extension. For information about Xdebug tools for other browsers, consult the browser documentation.
To use Xdebug Helper with Chrome:
- Create an SSH tunnel to the Cloud server.
- Install the Xdebug Helper extension from the Chrome store.
-
Enable the extension in Chrome as shown in the following figure.
- In Chrome, right-click
 in the Chrome toolbar.
 - From the pop-up menu, click Options.
- From the IDE Key list, click PhpStorm.
-
Click Save.
- Open your PhpStorm project.
-
In the top navigation bar, click
 (Start listening).
If the navigation bar isn’t displayed, click View > Navigation Bar.
- In the PhpStorm navigation pane, double-click the PHP file to test.
Debug code locally
Due to your environments being read-only, you need to pull code locally from an environment or specific Git branch/respository to perform debugging.
The method you choose is up to you. You have the following options:
-
Check out code from Git and run
composer installThis method works unless
composer.jsonreferences packages in private repositories to which you don’t have access. This method results in getting the entire Magento codebase. -
Copy the
vendor,app,pub,lib, andsetupdirectoriesThis method results in your having all code you can possibly test. Depending on how many static assets you have, it could result in a long transfer with a large volume of files.
-
Copy the
vendordirectory onlyBecause most Magento and third-party code is in the
vendordirectory, this method is likely to result in good testing although you won’t be testing the entire codebase.
To compress files and copy them to your local machine:
- SSH to the environment.
-
Enter the following command:
tar -czf /tmp/<file name>.tgz <directory list>For example, to compress the
vendordirectory only, entertar -czf /tmp/vendor.tgz vendor -
On your local environment with PhpStorm, enter the following commands:
cd <phpstorm project root dir>
rsync <SSH URL>:/tmp/<file name>.tgz .
tar xzf <file name>.tgz
Troubleshooting Xdebug
If you you suspend your laptop (like closing your lid on a Mac), then your SSH session may no longer work when your computer resumes. But the TCP session for the SSH connection on the server might not timeout on the server, leaving any open debug sessions active and preventing you from using the nginx server.
Due to not having access to manually restart the nginx server, you need to locate and terminate SSH processes that haven’t timed out yet.
- SSH to the integration, staging, or production server.
- Enter
whoto view a list of SSH sessions. -
View existing SSH sessions by user. Be careful to not affect a user other than yourself!
- Integration: user names are similar to
dd2q5ct7mhgus - Staging: user names are similar to
dd2q5ct7mhgus_stg - Production: user names are similar to
dd2q5ct7mhgus
- Integration: user names are similar to
- For a user session that is older than yours, find the pseudo-terminal (PTS) value. For example,
pts/0. -
Kill the process ID (PID) corresponding to the PTS value using the following commands:
ps aux | grep ssh
kill <PID>
For example, suppose
ps aux | grep sshreturned the following:dd2q5ct7mhgus 5504 0.0 0.0 82612 3664 ? S 18:45 0:00 sshd: dd2q5ct7mhgus@pts/0To terminate the connection, you enter a kill command with the process ID (PID). For example:
kill 3664